The recent record 3Q21 results from Tesla gives us an opportunity to reflect on its fundamentals and address a number of misconceptions, including, the company’s competitive advantages and how it is leading the industry in the structural shift to electric vehicles and energy storage. While Hyperion Asset Management does not tend to look at the short term, the scale of which the business has grown over the past year and its market capitalisation recently topping $1 trillion, it is worth revisiting the value proposition Tesla holds.
Tesla was added to the global portfolio in January 2020 after analysing the business and the automotive and energy industries in detail for the past 6 years. Hyperion did not buy at an earlier stage because we wanted to be sure the business was sufficiently robust to achieve its long-term goals and concluded in early 2020 that the business had reached a critical inflection point. Tesla has since been a top holding (approximately 12%) in the global portfolio.
Hyperion identified several competitive advantages that include:
- innovative car designs,
- its deep vertical integration,
- over the air software updates (its cars functionally improve over time),
- best software/hardware interfaces,
- culture of continuous improvement and innovation,
- the best autonomous driving tech (that has the unique advantage of billions of miles of real-world data that grows exponentially as more cars are sold),
- a large super charger network,
- extremely loyal customers that love Tesla products and promote the cars to their friends and family,
- a distribution and marketing system that does not rely on a third-party distribution network,
- manufacturing, engineering, and software capabilities that are hard to replicate, and
- an ability to transfer its expertise over multiple products and revenue sources
Tesla is not a “concept” or “meme” stock. Hyperion is exploiting this misunderstanding for its clients.
Profitability
The profitability of the business has continued to improve as it gains scale and builds out additional production facilities globally.
Tesla’s revenue for 3Q21 was $13.76 billion (+57% year-on-year) and net income of $1.62 billion (+389% year-on-year). This marks Tesla’s second quarter in a row of net income over $1 billion. We believe the majority of non-holders have not noticed how profitable Tesla is at an underlying level and is still viewing Tesla through the prism of a start-up, not as a company that has achieved scale and financial security.
Tesla achieved a record 3Q21 operating profit ($2 billion +148% year-on-year) representing an operating margin of 14.6%. Tesla has already reached their medium-term guidance of operating margins in low-teens which is very impressive with only 2 factories operational, global chip, and battery cell shortages, building two factories, $190m in share-based payments to Elon Musk, increased supply chain costs, and a Bitcoin-related impairment of $51m. The two largest auto manufacturers Volkswagen and Toyota achieved operating margins of 7.6% and 12.6% (3Q21) respectively. The strength of the Tesla result in this context was a positive shock and provides a glimpse into the future where we believe Tesla will be incredibly profitable at scale.
One criticism that is often leveled at Tesla is that the company only makes money because of regulatory credits paid by competitors. This is a false narrative as Tesla only received $279 million in regulatory credits from competitors for 3Q21, down 30% year-on-year. Further we note there is no evidence that incumbent auto original equipment manufacturers (OEMs) can produce electric vehicles profitably (unlike Tesla).
Tesla’s profitability will continue to rise long term as margins creep higher as both Berlin and Texas Gigafactory’s turn to production. The true fundamental value is starting to unfold and by the financials alone, Tesla is already an industry leader.
Production
The true story of Tesla’s short-term success lies in its ability to revolutionise production lines. Deliveries in 3Q21 easily beat expectations with a total of 241,391 vs 220,000 expected (+20% quarter-on-quarter, +73% year-on-year). They are well on their way to delivering close to 1 million cars this year. Over a multi-year horizon, Tesla expects to achieve 50% average annual growth in vehicle deliveries. It is clear Tesla does not have a demand problem with large, growing waiting lists. The main impediment to scale appears to be the rate at which it can source battery cells and produce vehicles.
Tesla’s ability to design and make the machines that make the machines, enables Tesla to be extremely efficient and continually innovate its processes such as reducing the rear body on the Model Y from 70 pieces to two pieces. In the soon to be operational Berlin Gigafactory, Tesla is able to produce one car body (Model Y) every 45 seconds.
Tesla’s manufacturing competitive advantage is what will separate the company from its competitors once other OEMs reach electric vehicle (EV) scale. Capacity will continue to ramp at Gigafactory, Shanghai, and new capacity will come online this year and early next in Berlin and Texas. Texas and Berlin are expected to start at 5,000 cars per week and build to 500,000 each per year in the initial phase. All three facilities have room to grow to 1 million cars a year in the medium term and significantly higher levels in the longer term.
Hyperion believes Tesla’s speed of innovation is unmatched in the industry. In fact, we believe Amazon was the most innovative company we have seen, only to now be surpassed by Tesla.
Traditional OEMs are crippled by years of outsourcing innovation, generally high debt levels, unionised work forces and lack of vertical integration. They are building their EVs based on old OEM infrastructure production lines and ICE vehicle blueprints. To fund their push into EVs they will run the risk of cannibalization of their current profit-making ICE vehicles for investment in EV products. Additionally, traditional OEMs are very slow moving and have many levels of bureaucracy to deal with. This is in stark contrast to Tesla’s ability to change direction and innovate very quickly. Unfortunately, many traditional auto companies will fail, and it will be investors that will ultimately wear the cost of this transition. A paradigm shift is occurring in the auto industry and a new traditional group of winners will emerge to replace the traditional incumbents.
Demand and Market Share
Demand for Tesla products is second to none in the EV space. Waiting times for deliveries are approximately six months for the Model 3 in the northern hemisphere. Tesla has recently redesigned both their Model S & Model X vehicles and is bringing the Cybertruck to production in the back end of 2022. All these vehicles have strong order books.
Most of this year’s significant price increases for Tesla’s key products are to manage excess demand and are not due to increased supply chain costs. Tesla has continually raised prices as they don’t want the wait times to be more than 6 months, but demand is so strong that the recent price increases were inelastic.
All of this has been achievable with zero dollars spent on advertising. Clearly, Elon Musk generates huge publicity and media attention through his high profile and social media presence.
Tesla is at its heart a technology and engineering company. The chart below shows advertising and R&D spend per vehicle vs marketing spend across the auto industry.
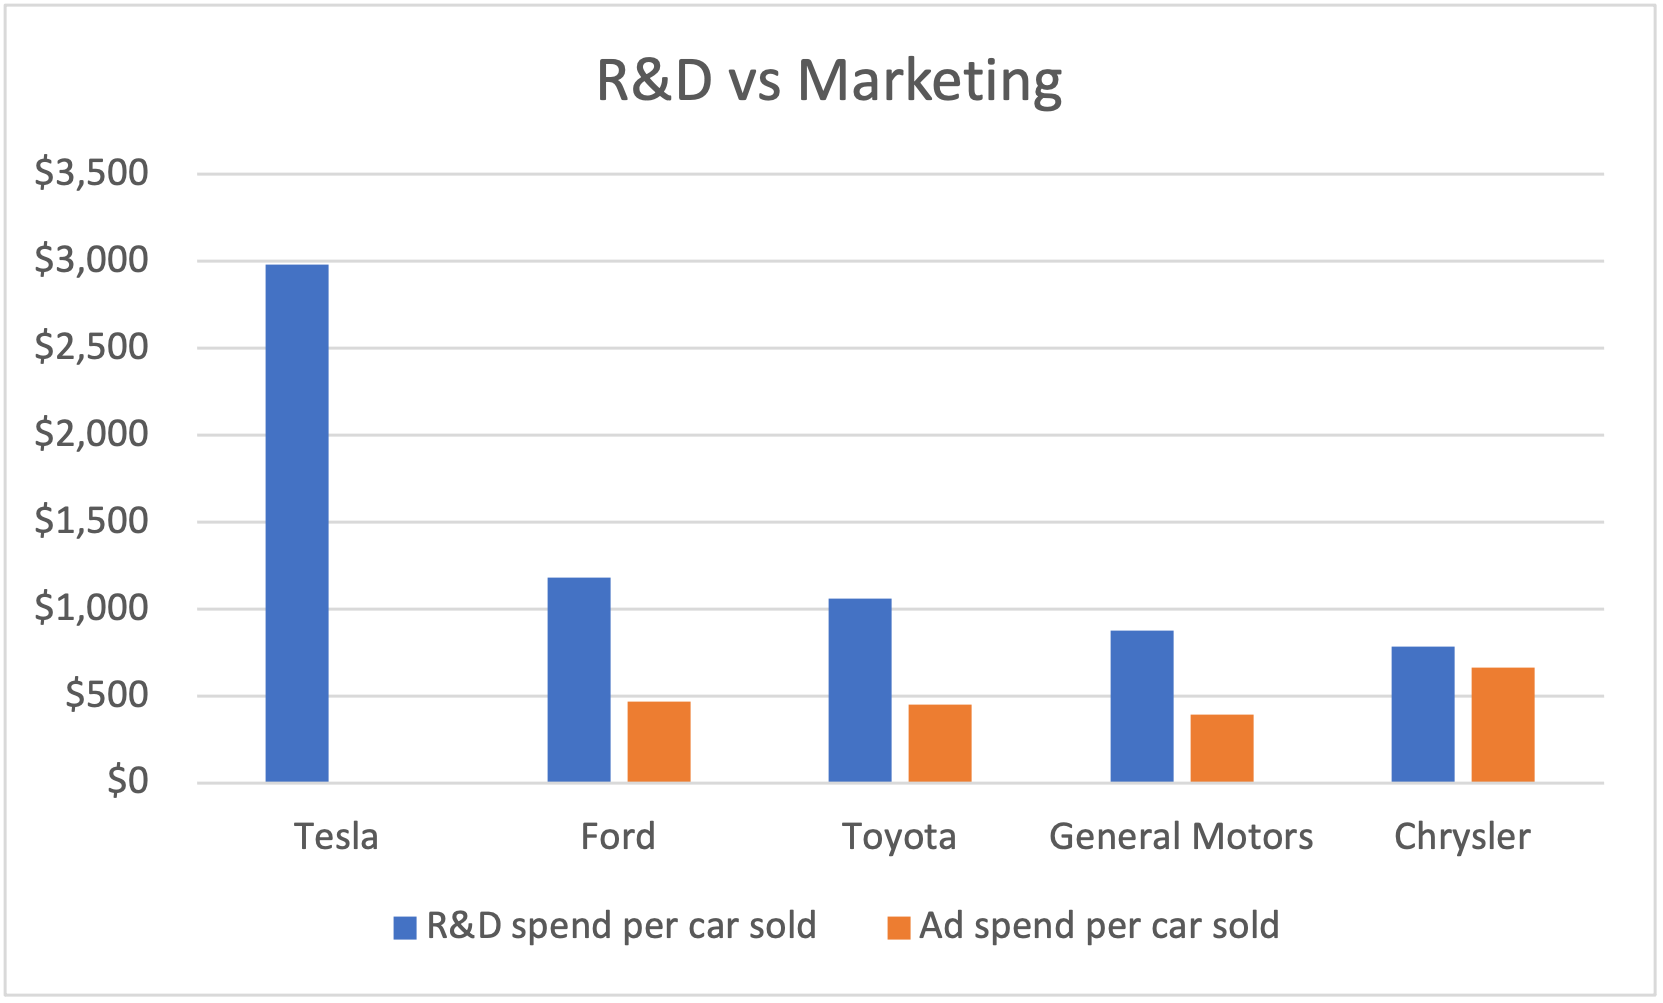
Source: SEC 10-k filings 2020
Tesla invests heavily on research and development and has been rewarded with nearly 20% market share of global EV sales (year to date 2021). Volkswagen, currently the highest selling ICE vehicle manufacturer, has 12% market share of the overall auto market, while EV sales are estimated to have less than 5% penetration globally this year. We believe this penetration rate will increase exponentially over the next decade based on current consumer preferences, particularly the next generation of drivers. Today, 40% of U.S. consumers say they are likely to consider an electric vehicle the next time they are in the market for a new vehicle, according to Pew.
Energy Generation and Storage
Revenue from energy generation and storage hit $806 million in 3Q21. Due to being battery constrained, revenue contribution from the energy division remains at 6% of sales (9 months, year to date). We believe based on the size of the addressable market its disrupting, that the energy business will be larger than the auto business long term.
In the last year, Tesla’s solar deployments have grown 46% and storage has grown 71%, producing 346MW of solar and 4.2 GWh of storage, respectively. While this is strong growth, Tesla is supply constrained and has chosen to allocate the majority of available cells to its vehicle business. Tesla’s new Megapack factory will produce 40 GWh annually and is specifically producing for the energy business which will drive growth.
At its Battery Day held in September 2020, Tesla stated that its targeting 3 TWh per annum in total internal battery production for both vehicles and stationary storage by 2030. In addition, Tesla has gone to the major third-party battery suppliers including CATL and LG Chem and offered to buy all the batteries they can produce going forward. We estimate that the total energy storage produced by Tesla and its third-party suppliers in 2030 will be approximately 100x the level of production achieved in 2020. As a vertically integrated company, with technological and first-mover advantages in batteries, software, connectivity, and its own cell production, combined with Virtual Power Plant (VPP) experience, it will be hard for competitors to compete with Tesla.
Tesla owns and operates the largest global, fast charging network in the world with over 29,000 Superchargers. Tesla has recently announced that it will open its Supercharger network to non-Tesla owners, with an initial pilot program that has a subscription fee of €12.99 per month or €0.60 per kWh. Tesla’s competitive advantage versus other charging network businesses is its size and the ability to easily fund the investment required to solidify its lead as the largest network. This in itself could be a billion-dollar business but for Tesla it will likely be a small contribution in comparison to its other strongly growing businesses, further proof of Tesla’s optionality advantage.
Autonomy, Software, and Insurance
Software will progressively become a larger component of Tesla’s revenue and profits particularly as the autonomous driving software continues to improve over the next couple of years. Beta versions of Full Self Driving (FSD) are being released to select drivers in the USA. Musk has often stated FSD technology has the potential to be licensed to other manufacturers in the future.
Regardless, of how quickly you believe Tesla can reach level 5 autonomy, we believe the developments from FSD will at the very least enable a large and highly disruptive insurance business. With a Safety Score and lower insurance premiums, we believe the proportion of Tesla drivers accepting Tesla Insurance will be significant. The reliance on metrics such as age, sex, and length of driving to set insurance premiums is old technology. We believe the data set available to Tesla will mean it can price insurance more effectively and cheaply. Tesla is using software to provide real time feedback to drivers in the form of safety scores. We believe that this safety score feedback loop will improve the standard of Tesla drivers and create a strong economic incentive for Tesla drivers to learn to drive more safely and be rewarded through lower insurance costs. This is another large, traditional industry Tesla can disrupt. In fact, by taking a 10-year view we can identify a handful of potentially meaningful revenue drivers for Tesla. This means Tesla goes from looking optically expensive short term to potentially incredibly cheap long term.
Competitors
“Prototypes are easy, production is hard & being cash flow positive is excruciating” – Elon Musk
The recent IPO of Rivian gave us an insight into early-stage competition and a reminder of how difficult and expensive it is to go from prototype to high production levels at scale. Rivian currently has orders of 100,000 vehicles from Amazon and 50,000 for retail consumers. The plant will ramp up to an estimated production capacity of 150,000 vehicles annually which they would look to increase up to 200,000 in 2023. Rivian had operating losses of $1 billion in the first half of 2021 and expects capital expenditures to be $8 billion through to 2023 as they build out capacity. Elon Musk has stated that it takes longer to reach volume production than it does to build a factory. Achieving scale and positive cash flow will be difficult, Rivian and its investors have their work cut out for them.
Volkswagen Management has held crisis meetings to address the efficiencies of Tesla production with anecdotal reports of the Model 3 being produced in 10 hours, 3 times faster than Volkswagen’s ID.3. The Model Y is expected to be faster again.
Toyota which has previously been regarded as one of the better car manufacturers, produced 9.5 million vehicles in 2020 from over 60 Facilities. Tesla are on track to deliver close to 1 million vehicles this year from 2 factories, Fremont, California, and Shanghai.
Outlook and Market View
Valuing structural growth companies is not easy and requires a long-term framework. Many investors do not take a long-term view in order to value a business in 10 years’ time. Investors may be focused on linear results and may not understand exponential growth as it occurs so rarely, particularly at disruptive inflection points. Organic sales and profit growth drive stocks higher i.e. fundamentals. Tesla is showing that it is not only stealing market share but is a market leader and has a multi-year first mover advantage in electric vehicles, battery technology, real world data collection, AI and software including autonomy, and energy network technology. The well repeated comment that Tesla has a narrow lead of one to two years and will be quickly caught by the traditional auto makers is another example of a false narrative.
Tesla is not a Meme stock that trades on “tweets”, “meme”, or online chat forums sprucing.
Tesla is not a Concept stock; the industry, consumer demand and government regulations are driving structural change that is powerful, real and will last for many decades to come. We may well be in the midst of a Kodak or Nokia-like period in history for the auto and energy industries. Two key questions that should be asked are; 1) just how much of a head start does Tesla have, and 2) what is its future likely rate of innovation relative to competitors? Remember it is not the big that eat the small, it is the fast that eat the slow.
Hyperion believes the business is selling substantially below its likely long-term intrinsic value.
To hear more about why Tesla is not a meme or concept stock, register for Hyperion Asset Management’s upcoming webinar and live Q&A “Alpha, Inflation and Passive Investing in a New World”.
Webinar details
Date: Tuesday 23rd November 2021
Time: AEDT: 11:00am / AEST: 10:00am / NZST: 1:00pm
Duration: 45 mins
Location: Online
This communication is prepared by Hyperion Asset Management Limited (ABN 80 080 135 897 AFSL 238380) (Hyperion) as investment manager of Hyperion Australian Growth Companies Fund (ARSN 089548443), Hyperion Global Growth Companies Fund (Managed Fund) (ARSN 611084229) and Hyperion Small Growth Companies fund (ARSN 089548943) (‘Funds’). The Hyperion Global Growth Companies Fund – Class B changed its name to Hyperion Global Growth Companies Fund (Managed Fund) on 5 February 2021 in order to facilitate quotation of the fund on the ASX.
Pinnacle Fund Services Limited ABN 29 082 494 362 AFSL 238371 (‘PFSL’) is the product issuer of the Fund. PFSL is not licensed to provide financial product advice. PFSL is a wholly-owned subsidiary of the Pinnacle Investment Management Group Limited (‘Pinnacle’) ABN 22 100 325 184. The Product Disclosure Statement (‘PDS’) and Target Market Determination (‘TMD’) of the Fund is available at https://www.hyperion.com.au/. Any potential investor should consider the relevant PDS and TMD before deciding whether to acquire, or continue to hold units in, the Fund.
This communication is for general information only. It is not intended as a securities recommendation or statement of opinion intended to influence a person or persons in making a decision in relation to investment. It has been prepared without taking account of any person’s objectives, financial situation or needs. Any persons relying on this information should obtain professional advice before doing so. Past performance is for illustrative purposes only and is not indicative of future performance.
Whilst Hyperion, PFSL and Pinnacle believe the information contained in this communication is reliable, no warranty is given as to its accuracy, reliability or completeness and persons relying on this information do so at their own risk. Subject to any liability which cannot be excluded under the relevant laws, Hyperion, PFSL and Pinnacle disclaim all liability to any person relying on the information contained in this communication in respect of any loss or damage (including consequential loss or damage), however caused, which may be suffered or arise directly or indirectly in respect of such information. This disclaimer extends to any entity that may distribute this communication.
Any opinions and forecasts reflect the judgment and assumptions of Hyperion and its representatives on the basis of information available as at the date of publication and may later change without notice. Any projections contained in this presentation are estimates only and may not be realised in the future.
Unauthorised use, copying, distribution, replication, posting, transmitting, publication, display, or reproduction in whole or in part of the information contained in this communication is prohibited without obtaining prior written permission from Hyperion. Pinnacle and its associates may have interests in financial products and may receive fees from companies referred to during this communication. This communication may contain the trade names or trademarks of various third parties, and if so, any such use is solely for illustrative purposes only. All product and company names are trademarks™ or registered® trademarks of their respective holders. Use of them does not imply any affiliation with, endorsement by, or association of any kind between them and Hyperion.